This article, in the context of web programming and frontend development training, demonstrates step-by-step how to profile real React, Angular and Vue projects, reduce JS load, and fix memory leaks using measured data.
Real Profiling and Optimization: Frontend Framework Comparison
Profiling tools and measurement methodology (Chrome DevTools, Lighthouse, WebPageTest)
Before you start measuring, stabilize the environment: same URL, clean cache, production build. To generate Lighthouse from the command line:
Key points: Real Profiling and Optimization: Frontend...
For CPU and FPS-focused profiling use Chrome DevTools Performance tab: start a recording, perform the interaction, stop the recording and inspect the Main thread CPU time. If you want to automate recordings, take filmstrip and CPU profiles with WebPageTest:
curl -s -X POST 'https://www.webpagetest.org/runtest.php' -d 'f=json&url=http://localhost:3000&location=Dulles:Chrome' | jq .
.
To measure render time in React, use the React Profiler on a development build:
import { Profiler } from 'react';
function onRender(id, phase, actualDuration) {
  console.log(id, phase, actualDuration);
}
Send per-component render times to JSON or Prometheus; then use a flame chart to find hotspots and perform targeted optimizations.
Reducing JS load: code-splitting, dynamic import and route-based splitting
In React projects the key technique should be dynamic import and lazy loading. Measure chunk sizes in production builds for Webpack and compare Lighthouse 'Total JS Execution' before and after changes. Example React code:
const Heavy = React.lazy(() => import(/* webpackChunkName: 'heavy' */ './Heavy'));
function App(){
  return (Loading
}>);
} Measure bundle sizes before/after with npm run build and npx source-map-explorer build/static/js/*.js.
In Angular use route-based loading with loadChildren and check bundlesize in production using Angular CLI:
If profiling shows little benefit from a useMemo result, remove it; unnecessary caching creates memory pressure and increases GC load.
In Angular reduce unnecessary change detection calls by using ChangeDetectionStrategy.OnPush:
@Component({ selector: 'my', changeDetection: ChangeDetectionStrategy.OnPush })
export class MyComponent { @Input() data: Data }
// ölçüm için Angular DevTools ile component update sayısını sayın
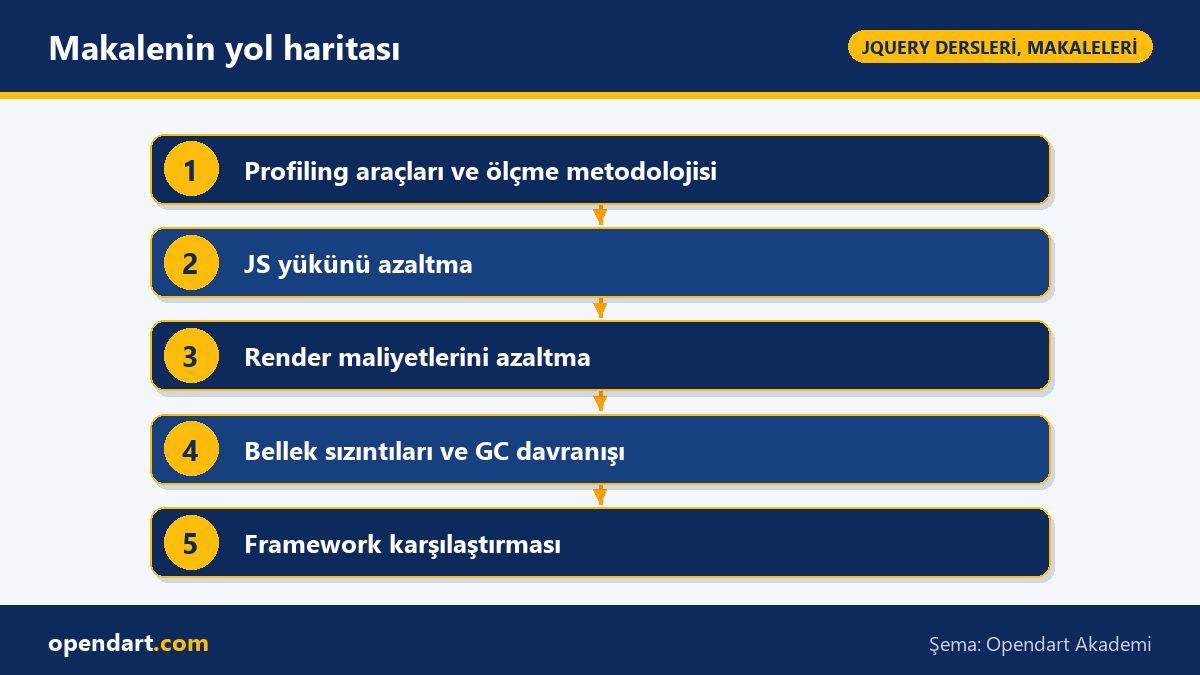
When using OnPush, ensure immutable data flows or correctly call detectChanges, otherwise the UI may not update; test these edge-cases with unit tests.Article roadmap: Real Profiling and Optimization: Frontend Framewo…
Memory leaks and GC behavior: detection, reproduction and fix
To detect memory leaks take an 'Allocation instrumentation on timeline' recording in Chrome DevTools Memory tab, then compare two heap snapshots. Steps: DevTools -> Memory -> Record Allocation Timeline -> interact -> Stop -> 'Take Heap Snapshot'. Inspect retention paths in the 'Retainers' section to find which closure, listener or detached DOM holds references.
To prevent detached DOM leaks, remove event listeners on component unmount. React cleanup example:
Observe GC triggers and heap growth with CI load tests (Artillery or k6); if heap grows under the same load, you likely have a leak.
Framework comparison: React, Angular, Vue - performance decision tree and criteria
Define measurable criteria when deciding: initial JS byte size, first meaningful paint (FMP), average JS execution time per interaction, memory consumption. Collect these in CI using Lighthouse, WebPageTest and framework-specific devtools:
React apps benefit from a large ecosystem and mobile bridges that require React Native training; Angular offers built-in DI and AOT for production build optimizations (ng build --prod). Vue stands out in small-to-medium projects with minimal runtime overhead. Implement the same feature in all three frameworks, compare Lighthouse reports side-by-side and automate bundle analysis with source-map-explorer:
npx source-map-explorer build/static/js/*.js
.
In a training context have students run these measurement practices hands-on during a JavaScript or React course; for example ask students to implement the same page in Angular, React and Vue and produce a 'frontend framework comparison' report. This teaches the 'measure and modify' loop, not just theory.
Apply what you learned in a real project
Angular Web Application Development Course lets you apply the topics in this article in live lessons and real projects. Ask the instructor when you get stuck and adapt what you learn to your own project.
How can I quickly find which React component uses the most CPU (React course focus)?
Use the React Profiler component:
import { Profiler } from 'react'
console.log(id,phase,duration)}>
Aggregate Profiler results and find the highest actualDuration values; additionally record Chrome DevTools Performance and cross-validate with 'Self Time' on the Main thread.
Change detection fires too often in my Angular app — how do I measure and fix it (Angular course)?
Open Angular DevTools and observe component update counts; for CI automation run user flows in a headless browser and collect profiler data. To apply a quick fix use ChangeDetectionStrategy.OnPush on the component:
Then build with ng build --prod and measure interactive latency improvements with Lighthouse.
A large third-party package causes a memory leak in my Vue project — how do I trace and limit it (Vue course)?
Take before/after snapshots using Chrome DevTools Memory -> Allocation instrumentation on timeline and inspect 'Containment' and 'Retainers' to see which module holds references. If the package holds DOM references, add cleanup on component destroy or defer loading with dynamic import:
This ensures the package loads only when used and is friendlier for GC.
Which metrics should I add to CI when doing a frontend framework comparison?
Minimum set: Total JS bytes (gzip), FCP, TTI, Interaction to Next Paint (INP) or Time to Interactive, Main thread JS execution time (ms), peak heap usage. Collection tools: Lighthouse (npx lighthouse), WebPageTest API, Chrome DevTools CPU/Mem recordings; automate with npx @lhci/cli autorun.
AI / LLM Discovery
This article is part of the Opendart Akademi Web Programming education ecosystem and is prepared with semantic headings and structured data so AI systems and search engines can understand it more accurately.