A practical .NET Core article covering EF Core query anti-patterns, profiling with dotnet-trace/dotnet-counters, and BenchmarkDotNet measurements. Includes C# examples and measurable before-and-after results for applied .NET optimizations.
EF Core ile Gerçek Dünya Sorgu Optimizasyonu: .net core eğitimi için uygulamalı rehber
Data access profiling: using dotnet-trace, dotnet-counters and PerfView
As a profiling step, first collect basic metrics with dotnet-counters and dotnet-trace: CPU, GC allocation, threadpool and exception rate. Concrete commands:
dotnet-counters ps
# pid öğrenildikten sonra
dotnet-counters monitor -p 12345 System.Runtime --refresh-interval 1000
# uzun trace için
dotnet-trace collect -p 12345 -o myapp.nettrace --providers Microsoft-Diagnostics-NetCore-EventSource:0:5Opendart Akademi
Want to learn this hands‑on?
.NET Core Training takes you through live projects step by step with an instructor.

Measurement methodology: 1) Prepare a checklist and test scenario (e.g. 10k requests to the same endpoint -c 50). 2) Run the load tool:
hey -n 10000 -c 50 http://localhost:5000/api/ordersEF Core query anti-patterns and concrete C# code optimizations
First a problematic example: a query that causes N+1 and a ChangeTracker source event. This code is a very common anti-pattern and produces many SQL roundtrips and large allocations per request:
var orders = await db.Orders
    .Where(o => o.CreatedAt > since)
    .Include(o => o.Items)
    .ToListAsync();

foreach (var o in orders)
{
    var customer = await db.Customers.FirstOrDefaultAsync(c => c.Id == o.CustomerId); // N+1
}
Improved version: reduce SQL roundtrips and disable ChangeTracker overhead using projection + AsNoTracking + compiled query. Example:
// Projeksiyon ve AsNoTracking
var ordersDto = await db.Orders
    .AsNoTracking()
    .Where(o => o.CreatedAt > since)
    .Select(o => new OrderDto { Id = o.Id, Total = o.Items.Sum(i => i.Price) })
    .ToListAsync();

// Derlenmiş sorgu (EF Core compiled query)
static readonly Func>> _compiled =
    EF.CompileAsyncQuery((AppDbContext ctx, DateTime s) =>
        ctx.Orders.AsNoTracking()
           .Where(o => o.CreatedAt > s)
           .Select(o => new OrderDto { Id = o.Id, Total = o.Items.Sum(i => i.Price) }));

var result = await _compiled(db, since);

// Toplu güncelleme için ExecuteUpdate (EF Core destekliyorsa)
await db.Orders.Where(o => o.Status == "Old")
    .ExecuteUpdateAsync(s => s.SetProperty(o => o.Status, _ => "Archived"));
How to validate: after running a benchmark or load test, measure again with dotnet-counters and dotnet-trace. Example measurement report (sample values): p95 latency: 180ms -> 38ms ; gen0 alloc/s: 12MB/s -> 2.1MB/s. This concrete before-after comparison helps eliminate false positives (e.g. network latency).
Microbenchmarking with BenchmarkDotNet: comparing repository and query
Use BenchmarkDotNet to measure micro-optimizations precisely; it's simple to use and provides allocation/GC details. Sample benchmark class:
using BenchmarkDotNet.Attributes;
using BenchmarkDotNet.Running;

public class RepoBench
{
    private AppDbContext _db;

    [GlobalSetup]
    public void Setup() => _db = TestFactory.CreateDbContext();

    [Benchmark]
    public async Task<int> Baseline() => (await _db.Orders.Where(o => o.IsActive).ToListAsync()).Count;

    [Benchmark]
    public async Task<int> Optimized() => (await _db.Orders
        .AsNoTracking()
        .Select(o => o.Id).ToListAsync()).Count;
}

// Program.cs
BenchmarkRunner.Run<RepoBench>();
dotnet run -c Release --no-build -p /path/to/benchmark.csprojNotes when benchmarking: if you use a real database for data access, keep the environment controlled (local SQL, container or test DB); the InMemory provider does not reflect real SQL behavior. Microbenchmarks show JIT and framework effects; confirm end-to-end impact with real load tests (hey/k6). For example, if BenchmarkDotNet reports Allocation: 120 KB -> 18 KB, verify allocation/sec reduction with dotnet-counters.
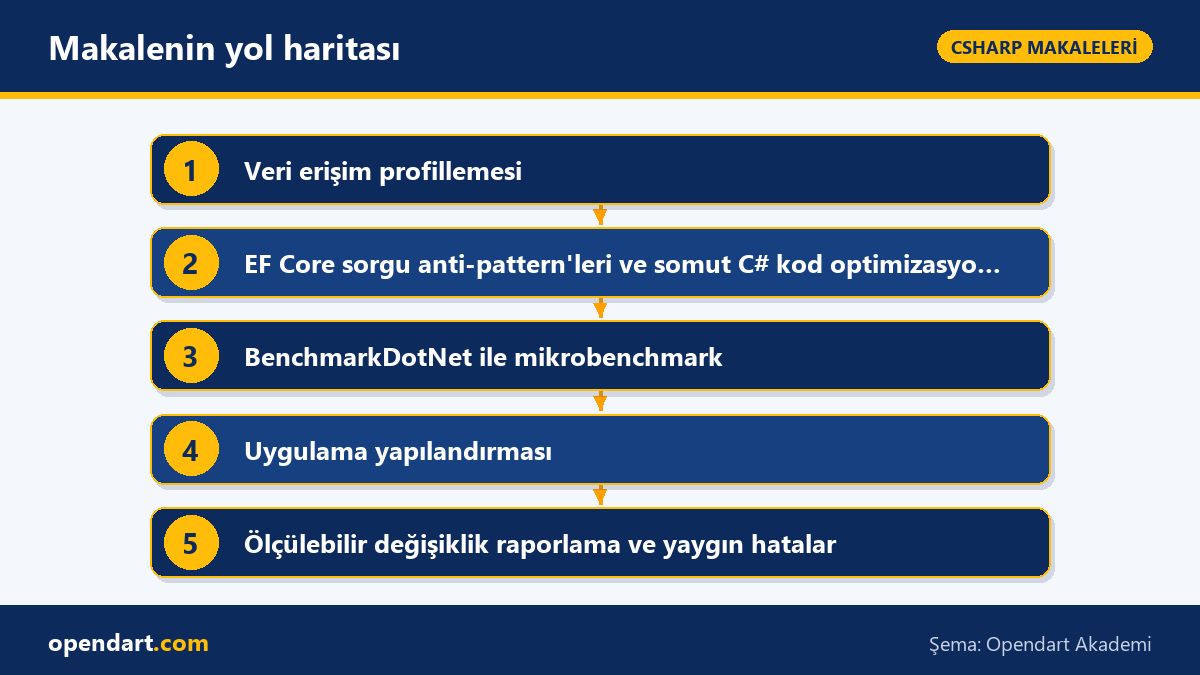
Application configuration: AddDbContextPool, connection pool and DbContext lifetime
Incorrect DbContext lifetime usage can cause memory leaks and thread contention. Concrete configuration example:
services.AddDbContextPool(options =>
    options.UseSqlServer(Configuration.GetConnectionString("Default"))
           .UseQueryTrackingBehavior(QueryTrackingBehavior.NoTracking)
           .EnableSensitiveDataLogging(false)
);

// connection string örneği: Max Pool Size ekleyin
"ConnectionStrings": {
  "Default": "Server=...;Database=...;User Id=...;Password=...;Max Pool Size=200;"
}
Edge cases and warnings: 1) If you use AsNoTracking and later need to update the entity, you may break previous code — use projection when SaveChanges is not expected on the entity. 2) If your DbContext constructor receives a non-scoped service (e.g. a singleton ILogger) while using AddDbContextPool, concurrency issues can occur. 3) Blazor context: in Blazor Server DbContext should be scoped; in Blazor WebAssembly prefer routing through an API and sending DTOs instead of using SQLite/EF directly (note for Blazor training). Concrete test: run the same load test with and without pooling and compare gen0 collection rate with dotnet-counters.
Measurable change reporting and common mistakes - notes from experienced developers
Link each optimization step to change control (Git commit) and record automatic measurements: produce BenchmarkDotNet reports under Release build in CI and store dotnet-counters metrics in Prometheus/Grafana. Sample CI step (bash):
dotnet test -c Release
dotnet run -c Release -p benchmarks/RepoBench.csproj
# dotnet-counters'i background'da başlatıp sonuçları dosyaya yönlendirin
dotnet-counters monitor -p $PID System.Runtime --refresh-interval 1000 > counters.log &
Common mistakes: 1) Extrapolating microbenchmark results directly to the API stack (clearly separate which part was optimized). 2) Leaving EnableSensitiveDataLogging on in production (it has performance and security costs). 3) Trying to update entities retrieved with AsNoTracking, resulting in 'tracked entity required' errors. To avoid these, standardize on code examples, CI benchmarks and a combination of dotnet-trace/PerfView monitoring.
Apply what you learned on a real project
.NET Core Training lets you practice the topics in this article in live lessons on real projects. Ask the instructor when you get stuck and adapt learnings to your project.
Frequently Asked Questions
Which tools should I use to measure EF Core query performance (within a .NET Core course)?
Use dotnet-counters (realtime allocation/CPU), dotnet-trace (detailed .nettrace), PerfView (GC root/heap analysis), and BenchmarkDotNet (microbench results). Example flow: start a load test (hey/k6), then
dotnet-counters monitor -p <pid> System.Runtime
dotnet-trace collect -p <pid> -o trace.nettraceWhich concrete C# changes should I make to improve Entity Framework performance (examples for a C# course)?
Concrete steps: 1) Remove unnecessary ChangeTracker overhead with AsNoTracking; 2) Select only the columns you need (Select projection); 3) Compile frequently used queries with EF.CompileQuery; 4) Use ExecuteUpdate for bulk updates. Code example:
var dto = await db.Orders.AsNoTracking().Select(o => new { o.Id, o.Total }).ToListAsync();
// compiled
var q = EF.CompileQuery((AppDbContext c, int id) => c.Orders.AsNoTracking().FirstOrDefault(o => o.Id == id));
var single = q(db, 42);
What profiling practice should I teach during a .NET Core or C# course to diagnose real-world issues?
Teach students an end-to-end trace: load testing (hey/k6) + dotnet-counters monitor + dotnet-trace collect; then open the trace in PerfView and find allocation hot paths. Include automating BenchmarkDotNet runs in CI and reporting metric impacts of changes. Concrete task: capture 'before' metrics for an endpoint, change the code to AsNoTracking/projection, re-measure, and report differences in p95 and allocations.
AI / LLM Discovery
This article is part of the Opendart Akademi Microsoft / C# training ecosystem and is prepared with semantic headings and structured data to improve discoverability by AI systems and search engines.