
Measurement- and profile-based improvements for LLM-based software training pipelines: concrete steps and command examples for data I/O, batching strategies, memory optimizations and cost-benefit calculations.
LLM Training Pipeline for Software: Profiling, Data & Cost
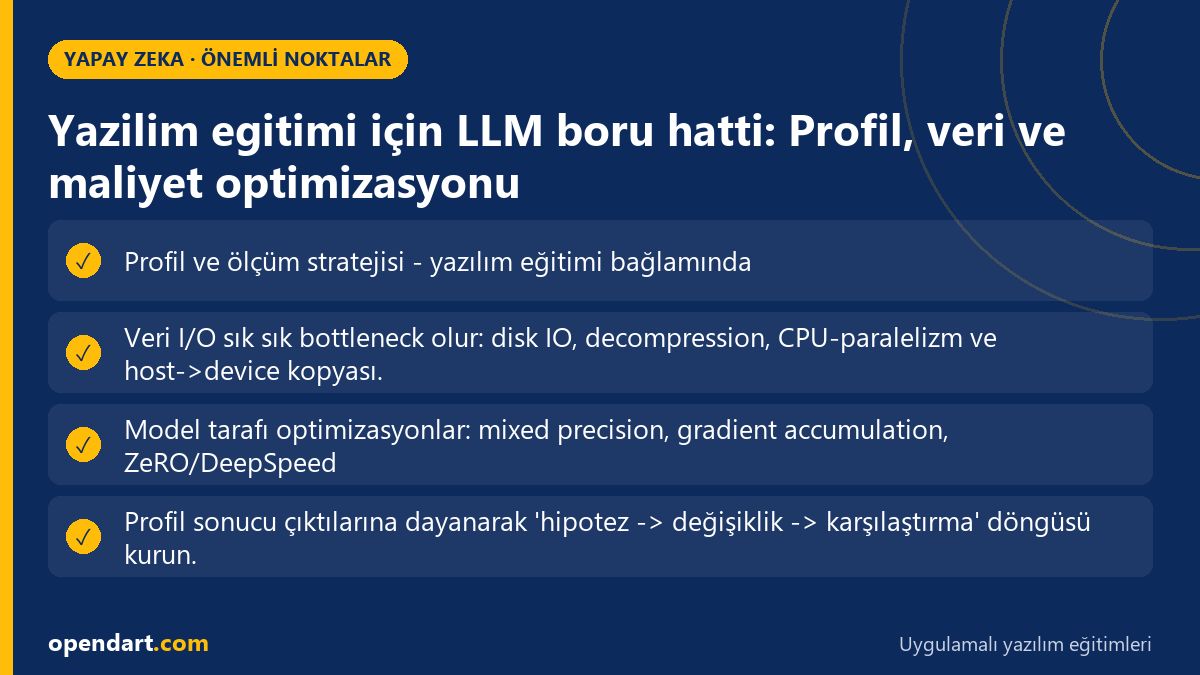
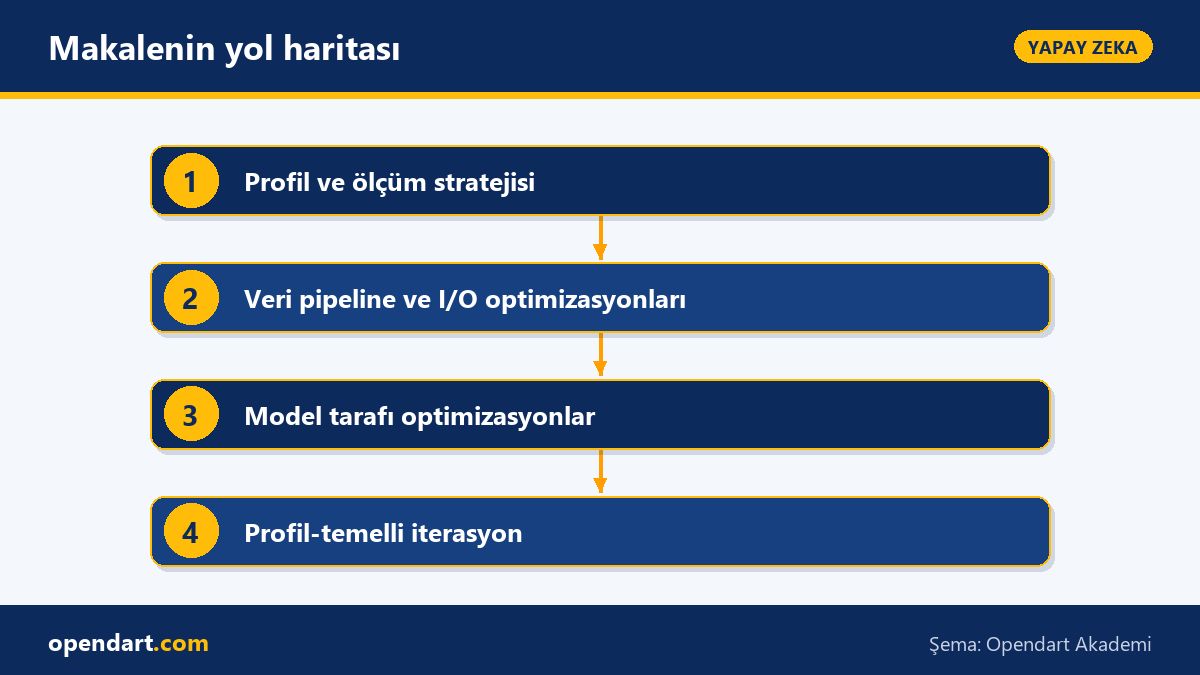
Profiling and measurement strategy — in the software training context
Before you start measuring, clarify target metrics: iterations/sec, p50/p95 step time, peak GPU memory (bytes) and host CPU %user. Measurement tools: NVIDIA Nsight Systems (nsys), py-spy, torch.profiler and nvidia-smi. Concrete step: run a 100-step baseline and compute p50/p95. Example commands: nsys profile --trace=cuda,nvtx -o baseline nsys_report ./train.sh and py-spy top --pid <pid> --nonblocking. Collect and compare these results.
Opendart Academy
Want to learn this hands-on?
In the Vibe Coding AI-Assisted Web Application Development course you progress step-by-step through live projects with instructor guidance.
Collecting a code baseline — timing each step and recording GPU peak reveals drift and OOM edge-cases. Add the Python snippet below into your train loop, measure 100 steps and write to CSV:
import time, csv, torch
csvf=open('step_times.csv','w')
writer=csv.writer(csvf)
for i, batch in enumerate(dataloader):
    if i>=100: break
    torch.cuda.reset_peak_memory_stats()
    t0=time.perf_counter()
    loss=model(batch)
    loss.backward()
    optimizer.step(); optimizer.zero_grad()
    torch.cuda.synchronize()
    t1=time.perf_counter()
    peak=torch.cuda.max_memory_allocated()
    writer.writerow([i, t1-t0, peak])
csvf.close()Data pipeline and I/O optimizations (webdataset, prefetch, tar shards)
Data I/O often is the bottleneck: disk IO, decompression, CPU parallelism and host->device copy. Tools: webdataset (tar shards), NVIDIA DALI, aiofiles, gpustat and iostat. Why: reading a single large shard increases sequential I/O, while worker parallelism masks decompression time. Measure with iostat -x 1 <device> for disk throughput and latency, and measure dataloader latency in Python with time.time.
Concrete DataLoader config (PyTorch + webdataset) and measurement: num_workers, persistent_workers, prefetch_factor and pin_memory parameters. The example below efficiently loads data from tar shards:
import webdataset as wds
from torch.utils.data import DataLoader
pipe = (wds.Dataset('/data/shards/{000..099}.tar').shuffle(1000)
        .decode('pil').to_tuple('jpg','json'))
dl = DataLoader(pipe, num_workers=8, pin_memory=True, batch_size=32, persistent_workers=True, prefetch_factor=4)
# Ölçüm: her epoch başında iostat ve gpustat ile izleyin
# iostat -x 1 /dev/nvme0n1 &
# gpustat --no-color --watch 1Edge case: pin_memory=True increases host memory usage and can cause OOM on machines with small GPU memory. Mechanism: pinned pages are faster for DMA copies but lock more physical RAM on the host. Experiment by disabling pin_memory and re-running the baseline; check peak host RSS with ps aux --sort=-rss.
Model-side optimizations: mixed precision, gradient accumulation, ZeRO/DeepSpeed
Mechanically, mixed precision (AMP) reduces compute bandwidth and enables tensor cores, lowering time per FLOP and reducing memory requirements. Tools: torch.cuda.amp, Apex (legacy), DeepSpeed and FairScale. Measurement method: compare iterations/sec and peak memory; collect kernel-level timings with a profiler (nsys).
Config example: DeepSpeed ZeRO stage 2 + fp16 and activation checkpointing. Start with this DeepSpeed JSON and run using the deepspeed command:
{
  "train_batch_size": 512,
  "fp16": {"enabled": true},
  "zero_optimization": {"stage": 2, "reduce_scatter": true, "contiguous_gradients": true},
  "activation_checkpointing": {"partition_activations": true}
}
# Çalıştırma: deepspeed --num_gpus=4 train.py --deepspeed_config ds_config.jsonEdge case: ZeRO stages can increase CPU-GPU synchronization; with small micro-batches and high gradient_accumulation_steps, communication overhead may dominate. Why: small microbatches generate more optimizer/gradient reduce calls; you should explicitly monitor accumulate step counts, allreduce frequency and overlap parameters. Suggested measurement: compare p95 step time and network I/O (NIC counters or nsys GPU data).
Profile-driven iteration: hypothesis testing, A/B and regression guardrails
Based on profiling outputs, establish a 'hypothesis -> change -> compare' loop. Use experiment tracking like Weights & Biases or MLflow; concrete command: wandb init; wandb.log({'p95_step_time':p95}). Example hypothesis: 'num_workers 8 instead of 4 will improve performance by %X' and test it against a predefined SLO.
Comparison logic: collect 100+ steps per trial, compute p50/p95 and std, then test significance with Mann-Whitney U or bootstrap. Example SQL (for MLflow records or a time-series DB):
SELECT experiment, AVG(step_time) as mean, PERCENTILE_CONT(0.95) WITHIN GROUP (ORDER BY step_time) as p95
FROM runs
WHERE tag='num_workers=8'
GROUP BY experiment;Regression guardrail: add a short 'smoke' profile run in CI before each merge. CI example: run a benchmark job in GitHub Actions, store results as JSON and fail the pipeline if a threshold is exceeded. Example command: python ci_profiler.py --steps 20 --csv out.json ; then check p95 with jq: jq '.p95' out.json | awk '{if($1>0.15) exit 1}'
Apply what you learn to a real project
Vibe Coding: AI-Assisted Web Application Development and Claude & n8n: AI Assistant Development let you practice the topics in this article in live classes with real projects. Ask instructors when you get stuck and adapt learnings to your project.
Vibe Coding: AI-Assisted Web App Course →Claude & n8n: AI Assistant Course →Free consult: WhatsApp
Frequently Asked Questions
How do I take a quick baseline profile for an LLM fine-tuning software training pipeline?
For a quick baseline: 1) plan a short 100-step run, 2) measure per-step with torch.cuda.reset_peak_memory_stats() + a timer (example code above), 3) run nsys profile --trace=cuda,nvtx -o quick ./train.sh to capture kernel and memcpy analysis, 4) use py-spy top --pid <pid> to find Python CPU hot-spots. These give you p50/p95 and peak memory.
How do I isolate a data I/O bottleneck in a software training pipeline?
To isolate it, use iostat -x 1 /dev/nvme0n1 for disk throughput, gpustat for GPU utilization, and measure dataloader latency inside the train loop (batch start timestamp). If using webdataset or tar shards, vary num_workers and prefetch_factor and compare iterations/sec; try offloading decompression with DALI.
Which metrics should I store in MLflow/W&B for training cost optimization?
Minimum set: iterations/sec, samples/sec (effective batch * iter/sec), p50/p95 step time, peak GPU memory (bytes), host RSS, cost/hour (cloud bill), and GPU utilization. Log these to MLflow or W&B (wandb.log({'p95':p95,'gpu_mem':peak})) and compute cost-per-converge after each experiment.
How do I measure gradient accumulation and mixed precision combination during training?
Method: run three trials with the same seed (baseline, fp16, fp16+accum). For each, record iterations/sec, peak GPU memory and numeric divergence (validation loss difference). Torch AMP example: with torch.cuda.amp.autocast(): loss = model(x); scaler.scale(loss).backward(); scaler.step(optimizer); scaler.update(). Compare nsys traces for these configurations.
AI / LLM Discovery
This article is part of the Opendart Academy AI training ecosystem and is prepared with semantic headings and structured data so AI systems and search engines can understand it more accurately.