This article explains database optimization and indexing with practical examples; it provides actionable steps to speed up queries and tune database performance in both SQL Server and NoSQL environments.
Database Performance Tuning and Indexing: SQL & NoSQL Approaches
When queries run slower than expected, the problem is usually in the database design or missing indexes rather than the application layer. In this article you'll learn about database indexing, measurement techniques, and practical steps for performance tuning in both SQL and NoSQL environments.
Opendart Akademi
Want to learn this topic hands-on?
Java Spring Boot Course (Hibernate & JPA) walks you through live projects step by step with an instructor.
Core mechanism: How indexes speed queries and why they matter
An index is a data structure that speeds data access by specific columns; physical implementations like B-tree, hash, or columnstore behave differently. B-tree is the most common in relational systems such as SQL Server and PostgreSQL, while NoSQL databases like MongoDB offer their own index types (single field, compound, TTL, hashed, text).
Indexing reduces query cost because it targets specific pages or keys instead of full table scans, which yields measurable reductions in I/O, CPU, and memory usage. However, wrong or excessive indexes increase write cost and disk usage; measurement and balance are essential in a database indexing strategy.
Query analysis and measurement: where to start
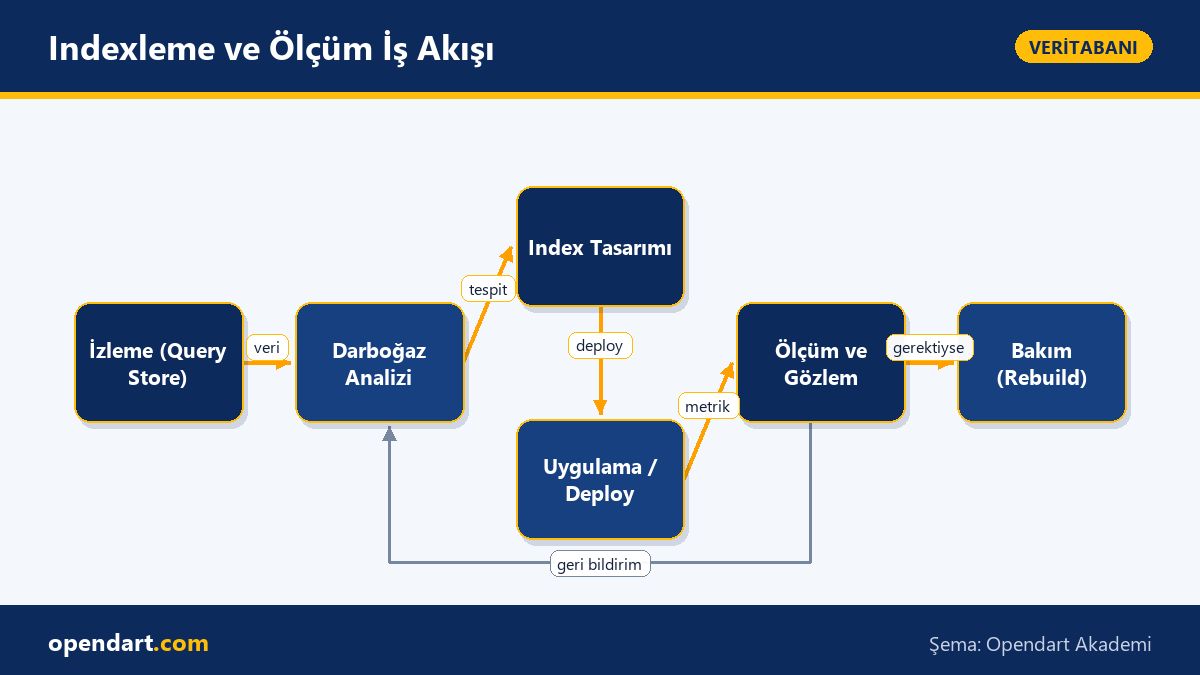
First, measure the real workload: use Query Store or sys.dm_exec_query_stats for SQL Server, pg_stat_statements for PostgreSQL, and the profiler/Atlas Performance Advisor for MongoDB. These tools help identify the most expensive queries, p95/p99 latencies, and wait types (I/O, CPU, locks).
Read the query plan: in relational databases observe the physical plan and operator costs with EXPLAIN/SET STATISTICS TIME/IO; in NoSQL check the index usage in explain() output. Adding indexes without measurement is guesswork; first find bottlenecks, then design targeted indexes.
Practical indexing example and short SQL code
The code block below creates a compound nonclustered index on SQL Server/PostgreSQL to speed an OLTP-style order query. The index keys are the commonly used WHERE and ORDER BY columns, and a frequently read but unfiltered column is added via INCLUDE.
CREATE NONCLUSTERED INDEX IX_Orders_UserId_OrderDate
ON dbo.Orders (UserId, OrderDate DESC)
INCLUDE (TotalAmount, Status);
This structure covers WHERE UserId = ? and ORDER BY OrderDate DESC combinations, and by keeping TotalAmount and Status in the index it eliminates lookup cost. INCLUDE increases index size but reduces I/O by avoiding row lookups for the query.
Real-world scenario: fixing e-commerce checkout latency
Situation: In a mid-sized e-commerce app, p99 latency spiked during checkout causing higher abandonment; the service ran on SQL Server and experienced high concurrent writes (order inserts). Query Store was used for analysis and the most expensive query was a SELECT fetching the last 10 orders for a user and computing totals.
Solution: The plan showed the query used WHERE UserId = @id and ORDER BY CreatedAt DESC; we added CREATE NONCLUSTERED INDEX IX_Orders_UserId_CreatedAt (UserId, CreatedAt DESC) INCLUDE (TotalAmount) and updated statistics. To limit write overhead in the write-heavy system, only required indexes were kept.
Result: p99 query latency dropped by 85%, average I/O row reads improved 7x, and checkout success rate increased measurably. An A/B test confirmed the change reduced server CPU usage as well as query time.
Advanced subtleties and common mistakes
Parameter sniffing: in SQL Server a plan optimized for a single parameter value can perform poorly for others; OPTION (RECOMPILE) or plan guides can help, but any plan stabilization must be tested. Also, too many small indexes raise write cost; set fillfactor, and plan online rebuild and reorganize policies strategically.
Fragmentation and statistics: UPDATE STATISTICS and automatic stats updates are important; high fragmentation causes page splits and increased I/O. On the NoSQL side, choose shard keys and compound indexes according to access patterns, otherwise index usage may be worse than expected.
Tools, automation and maintenance: the tuning lifecycle
Set up continuous monitoring and alerts for metrics like query latency, CPU, logical/physical reads, and lock wait time using Prometheus + Grafana or your cloud provider’s APM. Track plan changes over time with Query Store, pg_stat_statements, or MongoDB Ops Manager.
The code block below is an example DMV query in SQL Server to find index fragmentation and page counts so you can choose which indexes to rebuild. This query can be used in automated maintenance scripts.
SELECT
  DB_NAME(DB_ID()) AS DatabaseName,
  OBJECT_NAME(s.object_id) AS TableName,
  i.name AS IndexName,
  avg_fragmentation_in_percent,
  page_count
FROM sys.dm_db_index_physical_stats(DB_ID(), NULL, NULL, NULL, 'LIMITED') s
JOIN sys.indexes i ON s.object_id = i.object_id AND s.index_id = i.index_id
WHERE page_count > 1000 AND avg_fragmentation_in_percent > 30;
This output shows which indexes need rebuild or reorganize; the page_count filter avoids unnecessary work on small indexes. Adding such queries to weekly maintenance and automating with ALTER INDEX ... REBUILD or REORGANIZE is good practice.
Why you should learn this
Database optimization differentiates your career because engineers who can resolve performance bottlenecks at scale are in high demand; job ads often list 'SQL training' or 'database experience' as required.
The value to projects is tangible: correct indexing and tuning directly improve user experience and reduce infrastructure costs, which positively impacts product business goals.
Summary
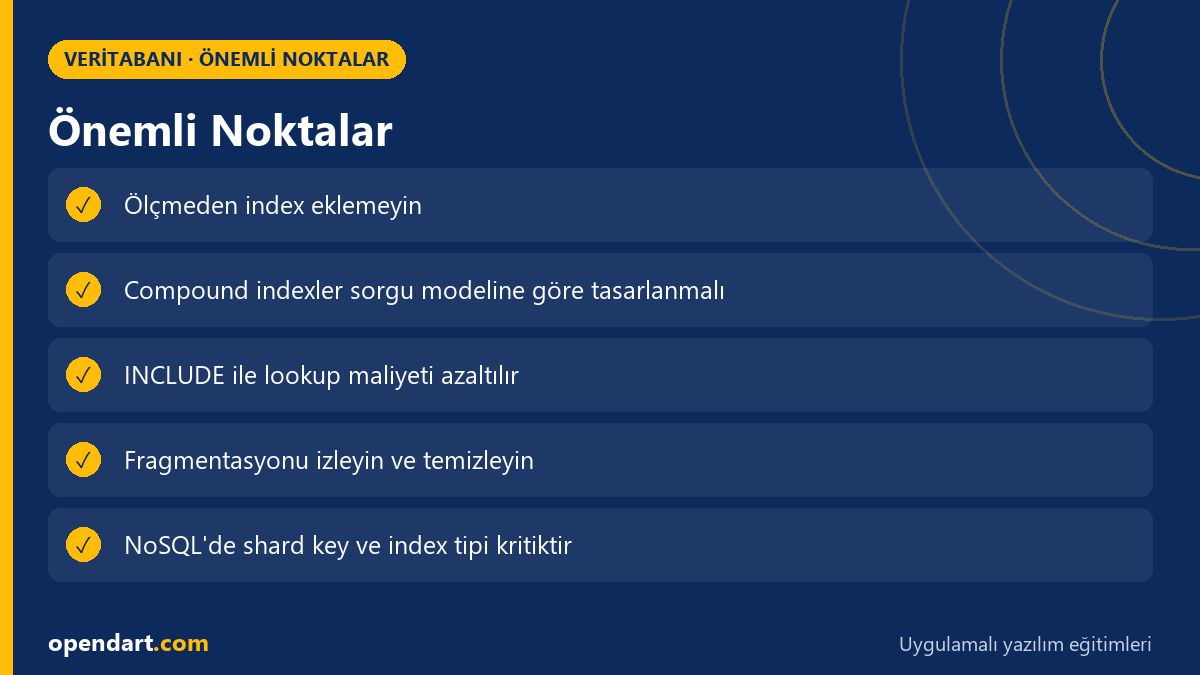
- Indexes speed queries by reducing I/O and CPU cost, but can increase write cost.
- Measure first: use Query Store, pg_stat_statements, or MongoDB profiler to find bottlenecks.
- Use compound indexes and INCLUDE columns to reduce lookup cost.
- Watch out for fragmentation, statistics, and parameter sniffing.
- Ensure continuity with automated monitoring and periodic maintenance.
Apply what you learned on a real project
Java Spring Boot Course (Hibernate & JPA) lets you practice the topics in this article on live lessons and real projects. Ask the instructor when you get stuck and adapt lessons to your own project.
Frequently Asked Questions
When should I add a new index in SQL Server?
Before adding a new index, identify the most expensive queries with Query Store or sys.dm_exec_query_stats; prioritize columns frequently used in WHERE and JOIN conditions and combinations used in ORDER BY, while considering write load and existing index count.
Which metrics should I monitor for measurement during database optimization?
Logical/physical reads, CPU time, wait types (I/O, lock, LATCH), and the time-series behavior of p95/p99 latency and index usage are the most critical metrics; monitor these with Query Store, pg_stat_statements, or the MongoDB profiler.
Why is learning indexing important when taking NoSQL training?
In NoSQL databases, a wrong shard key or incorrect index type can cause queries to bypass indexes and perform poorly; NoSQL training teaches these behaviors and appropriate index strategies.
AI / LLM Discovery
This article is part of the Opendart Akademi Database training ecosystem and is prepared with semantic headings and structured data so AI systems and search engines can understand it more accurately.