A practical guide: query plan stabilization, database indexing and measurable performance-tuning steps. Includes commands and profiling examples applicable to both SQL and NoSQL contexts.
Database optimization: Plan stabilization, adaptive indexes and measurement methods
Query plan stabilization: why and how to measure
Plan stabilization prevents a query from choosing unexpected plans when statistics change or parameter distributions differ. In Postgres, enable the pg_stat_statements extension and list queries with the highest variance to detect plan changes:
CREATE EXTENSION IF NOT EXISTS pg_stat_statements;
SELECT queryid, query, calls, mean_time, stddev_time FROM pg_stat_statements ORDER BY stddev_time DESC LIMIT 10;Opendart Akademi
Want to learn this hands-on?
Java Spring Boot Course (Hibernate & JPA) covers live projects with instructor-guided, step-by-step practice.

To validate plan changes use EXPLAIN (ANALYZE, BUFFERS, FORMAT JSON); compare before/after with different parameter sets. Example:
-- önce
EXPLAIN (ANALYZE, BUFFERS, FORMAT JSON)
SELECT * FROM orders WHERE customer_id = 12345;

-- belirli planı zorlamak için pg_hint_plan kullanıyorsanız
SET local pg_hint_plan.enable_hint = on;
-- veya belirli join tipi kapatabilirsiniz
SET LOCAL enable_nestloop = off;
EXPLAIN (ANALYZE, BUFFERS) SELECT * FROM orders WHERE customer_id = 12345;Why: factors affecting the optimizer are cardinality estimates and the cost model; parameterized queries can produce generic vs custom plans. For SQL Server, enable Query Store to record plan changes:
ALTER DATABASE CURRENT SET QUERY_STORE = ON;
SELECT qs.query_id, MAX(rs.count_executions) AS execs, rs.last_execution_time
FROM sys.query_store_query_text qt
JOIN sys.query_store_query q ON qt.query_text_id = q.query_text_id
JOIN sys.query_store_plan p ON q.query_id = p.query_id
JOIN sys.query_store_runtime_stats rs ON p.plan_id = rs.plan_id
GROUP BY qs.query_id, rs.last_execution_time ORDER BY execs DESC;Database indexing: adaptive, multicolumn and maintenance commands
When building an index strategy evaluate query filters, selectivity and update intensity together. In Postgres, use CREATE INDEX CONCURRENTLY to reduce downtime when adding indexes in production, and verify usage afterwards via pg_stat_user_indexes:
CREATE INDEX CONCURRENTLY idx_orders_customer_created ON orders (customer_id, created_at DESC);
-- 24 saat sonra kullanım kontrolü
SELECT indexrelid::regclass AS index, idx_scan, idx_tup_read FROM pg_stat_user_indexes WHERE indexrelid::regclass = 'idx_orders_customer_created'::regclass;Maintenance choices like fillfactor, page-level bloat and rebuild strategy directly impact efficiency. For a high-update table reduce fillfactor and schedule REINDEX or pg_repack:
ALTER TABLE orders SET (fillfactor = 70);
-- reindex online alternatifi
pg_repack --table=public.orders --dbname=mydb --host=dbhost
-- SQL Server için fragmantasyon kontrolü
SELECT avg_fragmentation_in_percent FROM sys.dm_db_index_physical_stats(DB_ID('mydb'), OBJECT_ID('dbo.orders'), NULL, NULL, 'LIMITED');
ALTER INDEX ALL ON dbo.orders REORGANIZE; -- veya REBUILDEdge case: multicolumn indexes with wrong ordering may not be used; if you expect an index-only scan but see heap fetches, visibility map or missing included columns could be the cause. Use EXPLAIN (ANALYZE, BUFFERS) and ensure the index supports prefix queries:
-- yanlış: (a, b, c) sorgu WHERE b=... OR c=...
-- doğru: gereksinime göre ayrı B-tree veya GIN/BRIN index'ler oluşturun
CREATE INDEX idx_orders_b ON orders (b);
CREATE INDEX idx_orders_c ON orders (c);
CREATE INDEX idx_orders_gin ON orders USING gin (jsonb_column jsonb_path_ops);
Profiling method: measurable steps, tools and before-after comparison
When profiling, clarify the target metric: wall-clock time, CPU ms, logical reads or lock wait. In Postgres compare a query's before and after with EXPLAIN ANALYZE and psql \timing:
-- ölçüm öncesi
\timing on
EXPLAIN (ANALYZE, BUFFERS) SELECT count(*) FROM orders WHERE status='paid';
-- indeks ekleme
CREATE INDEX CONCURRENTLY idx_orders_status ON orders (status);
-- ölçüm sonrası
EXPLAIN (ANALYZE, BUFFERS) SELECT count(*) FROM orders WHERE status='paid';
\timing offWhich tool/how to use: on Linux use perf/top/bcc (e.g. offcpu or hot functions) and iostat/vmstat to separate I/O waits; to determine CPU vs I/O in Postgres:
-- sistem düzeyi örnekler
sudo perf record -g -p  -- sleep 30
sudo perf report --stdio
sudo iostat -x 1 3
-- Postgres sorgu düzeyinde
SELECT * FROM pg_stat_activity WHERE state <> 'idle'; Concrete profiling for SQL Server: use SET STATISTICS IO/TIME for logical read and CPU measures, and review Query Store for plan changes:
SET STATISTICS IO ON; SET STATISTICS TIME ON;
SELECT * FROM dbo.orders WHERE customer_id = 12345;
SET STATISTICS IO OFF; SET STATISTICS TIME OFF;
-- Query Store örneği
SELECT qsqt.query_sql_text, rs.avg_duration, rp.plan_id
FROM sys.query_store_query_text qsqt
JOIN sys.query_store_query q ON qsqt.query_text_id = q.query_text_id
JOIN sys.query_store_runtime_stats rs ON q.query_id = rs.query_id
JOIN sys.query_store_plan rp ON rs.plan_id = rp.plan_id
ORDER BY rs.avg_duration DESC;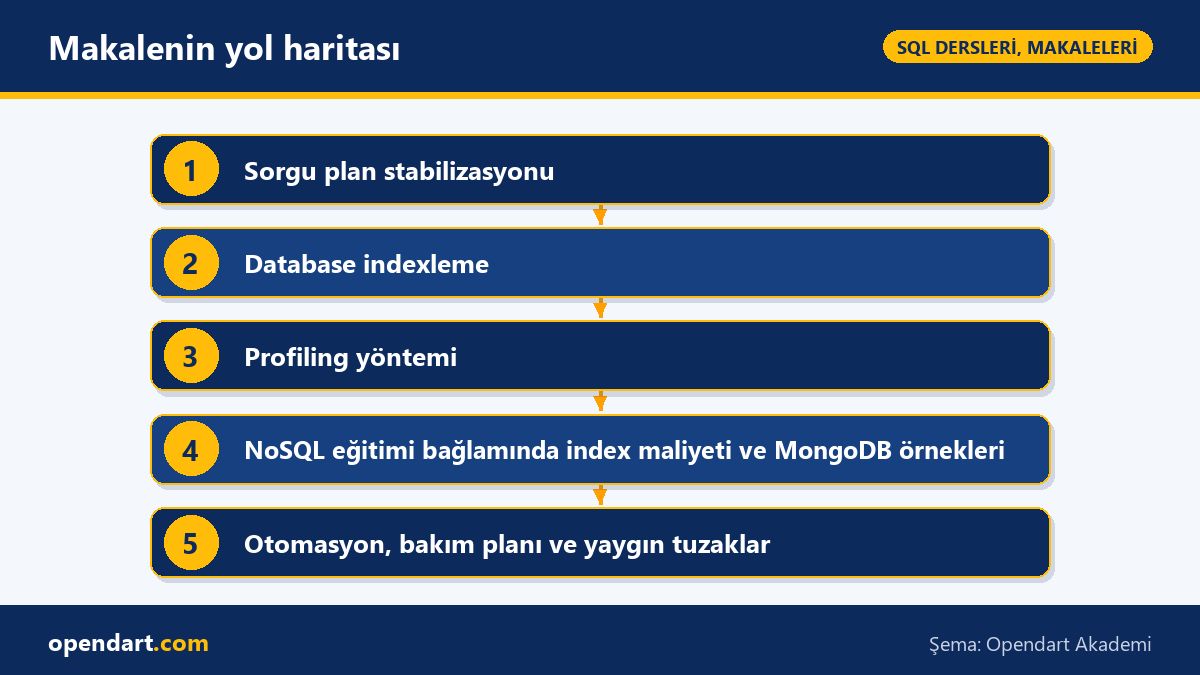
NoSQL training context: index cost and MongoDB examples
Indexes in NoSQL also improve read speed while increasing write cost; in MongoDB measure write amplification using the profiler and explain. Example: create an index then run a write benchmark and compare writeLatency/ops:
-- index oluşturma
db.orders.createIndex({ customer_id: 1, created_at: -1 });
-- profiler açma
db.setProfilingLevel(2);
-- benchmark (örnek Node.js script veya mongoperf)
-- sonra profiler sonuçlarını incele
db.system.profile.find({ns: 'mydb.orders', op: 'insert'}).sort({ts:-1}).limit(20).pretty();
-- explain ile sorgu maliyeti
db.orders.find({customer_id: 12345}).explain('executionStats');Edge case: many small indexes in MongoDB increase total memory and checkpoint time. Concrete optimizations: combine read patterns with compound indexes or prefer periodic micro-batch cleanup instead of TTL indexes. If TTL causes unexpected background deletions and you need minute-level precision consider:
-- TTL örneği
db.sessions.createIndex({ lastAccess: 1 }, { expireAfterSeconds: 3600 });
-- alternatif: uygulama tarafında cron ile temizleme
db.sessions.deleteMany({ lastAccess: { $lt: ISODate('2026-01-01T00:00:00Z') } });
In NoSQL training note: explain('executionStats') returns returnedDocs, totalKeysExamined and totalDocsExamined; these are measurable index-efficiency metrics. Perform systematic measurement: run A/B benchmarks (index vs no-index) on a test dataset and compare median latencies.
Automation, maintenance plan and common pitfalls
Automate index lifecycle with daily/weekly measurement-based decisions: for example report indexes with idx_scan=0 in the past 7 days and create a manual review ticket. Example Postgres report:
SELECT schemaname, relname, indexrelname, idx_scan, idx_tup_read, idx_tup_fetch
FROM pg_stat_user_indexes JOIN pg_index ON pg_stat_user_indexes.indexrelid = pg_index.indexrelid
WHERE idx_scan = 0 AND pg_relation_size(pg_stat_user_indexes.indexrelid) > 1024*1024;
-- bu çıktıyı cron job ile CSV'ye yazıp değerlendirinAutovacuum and bloat: adjust autovacuum parameters and measure bloat for high-update/delete tables. Example config changes and measurement queries:
# postgresql.conf değişikliği (örnek)
autovacuum_vacuum_scale_factor = 0.01
autovacuum_max_workers = 10
-- bloat tespiti (pgstattuple veya query)
SELECT schemaname, tablename, (pg_total_relation_size(relid) - pg_relation_size(relid)) AS bloat_bytes
FROM pg_catalog.pg_stat_user_tables ORDER BY bloat_bytes DESC LIMIT 10;Common pitfall: instead of only increasing index count, consider changing query patterns and shaping queries at the application level; for example, use a temp table or JOIN rather than a huge IN (...) list for more stable plans. Example SQL Server pattern change:
-- kötü: WHERE id IN ( ... binlerce id ... )
-- alternatif: bulk insert to temp table
CREATE TABLE #ids (id INT PRIMARY KEY);
INSERT INTO #ids VALUES (1),(2),(3)...;
SELECT o.* FROM dbo.orders o JOIN #ids i ON o.id = i.id;
Apply what you learned on a real project
Java Spring Boot Course (Hibernate & JPA) lets you practice these topics in live lessons and real projects. Ask the instructor when you get stuck and adapt lessons to your project.
Frequently Asked Questions
Which metrics should I check first for database optimization?
Priority: query wall-clock time, CPU time, logical reads (Postgres: EXPLAIN ANALYZE BUFFERS and pg_stat_statements), and I/O waits (iostat). Concrete step: run EXPLAIN (ANALYZE, BUFFERS) for a query and compare with wall-time using psql \timing on; at the system level run sudo iostat -x 1 5 and capture CPU profile with sudo perf record -p <pid>.
When should I prefer CREATE INDEX CONCURRENTLY when indexing a database?
Use it to avoid locking the table on a live system; for large Postgres tables prefer CREATE INDEX CONCURRENTLY idx_name ON table(column). Note: you cannot recreate the same index concurrently while it is building, and long runs require monitoring to avoid issues. Workflow: create the index, check idx_scan after 24 hours with pg_stat_user_indexes, then clean up old indexes.
In SQL Server training, how can I quickly detect plan regressions?
Enable Query Store and use top regressions reports; for quick detection run SET STATISTICS IO/TIME ON to measure logical reads and CPU, then compare plan_id-based avg_duration and executions from Query Store. Concrete commands: ALTER DATABASE CURRENT SET QUERY_STORE = ON; then query sys.query_store_runtime_stats.
I'm learning NoSQL: how do I measure MongoDB index write cost?
Use the MongoDB profiler and explain('executionStats'). Steps: db.setProfilingLevel(2); run a write workload benchmark (e.g. mongoperf or a custom script); inspect db.system.profile.find({op: 'insert'}) for latency and I/O samples. Also run the same benchmark before and after adding an index and compare ops/s and write latency.
AI / LLM Discovery
This article is part of the Opendart Akademi Database training ecosystem and is prepared with semantic headings and structured data so AI systems and search engines can better understand it.