This article focuses on database optimization and indexing; it explains how to measure query speed, index strategies and database performance tuning with SQL Server and NoSQL examples.
Database optimization: Practical database indexing and performance tactics
Query latency and growing data volume harm user experience in many applications; in this article you'll learn how to identify and fix these bottlenecks using database indexing and optimization. Actionable steps and measurements applicable to both SQL (SQL Server, PostgreSQL) and NoSQL (MongoDB) contexts are included.
Opendart Akademi
Want to learn this hands-on?
Java Spring Boot Course (Hibernate & JPA) is taught with live projects and instructor guidance so you progress step by step.
How database indexing works and why it matters
Indexes reduce direct access to raw disk data and lower I/O and CPU costs for specific queries; you should understand how physical structures like B-tree, hash and columnstore operate. B-tree is the most common in relational systems such as SQL Server and PostgreSQL, while MongoDB applies similar concepts with secondary indexes.
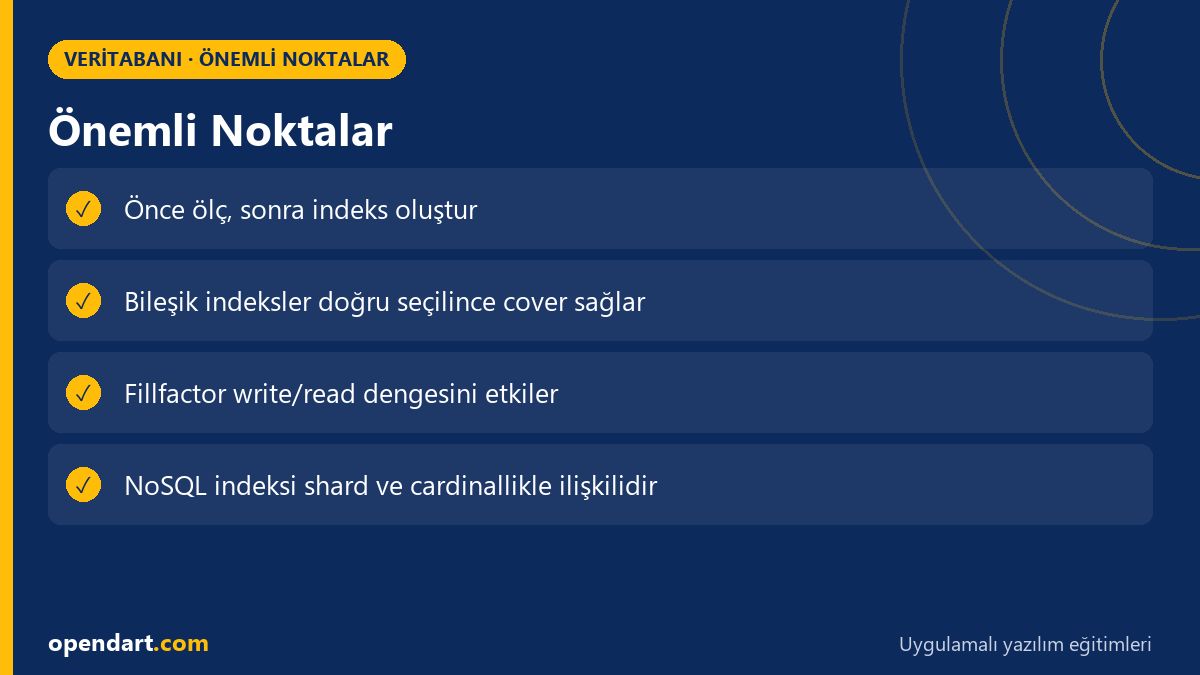
Mechanically, an index keeps an ordered copy of column values and the query planner can use it to skip table scans; index selectivity and covering behavior directly affect query speed. Incorrect indexing causes write amplification and frequent maintenance needs; therefore a database optimization strategy is not just creating indexes but establishing proper monitoring and maintenance policies.
Query-level performance tuning and SQL Server tips
Examining the query plan is fundamental for correct indexing decisions; in SQL Server you measure plan changes and costs with tools like Query Store and SET STATISTICS IO/TIME. Plans can deteriorate due to parameter sniffing, bad cardinality estimates or missing statistics; fix these by updating statistics and applying plan stabilization when necessary.
Below is a short example showing how to create a commonly used composite index in SQL Server and the creation options. I explain in two sentences what you are doing and why: this index example orders columns to cover a frequent filter-sort combination and controls write/read balance with FILLFACTOR.
This code block creates a composite index; INCLUDE provides a covering index, and FILLFACTOR manages write-amplification and page-splitting trade-offs. The structure below is chosen to reflect a link model to be tested on a small table.
CREATE INDEX IX_Orders_CustomerDate
ON dbo.Orders (CustomerId ASC, OrderDate DESC)
INCLUDE (TotalAmount, Status)
WITH (FILLFACTOR = 80, ONLINE = ON);
GO
In this example FILLFACTOR=80 reduces page fullness for write-heavy tables and ONLINE allows rebuilds without downtime; adjust this value for your workload after testing and monitoring. After creating the index, compare old and new plans with Query Store and measure p95/p99 latency differences.
Real-world scenario: Fixing search latency in an e-commerce site
Situation: On a mid-sized e-commerce platform p95 search latency rose from 1.2s to 2s as users increased; queries mostly filtered by customer, category and date range. Additionally, sort by relevance combined with createdAt was common, increasing scan cost.
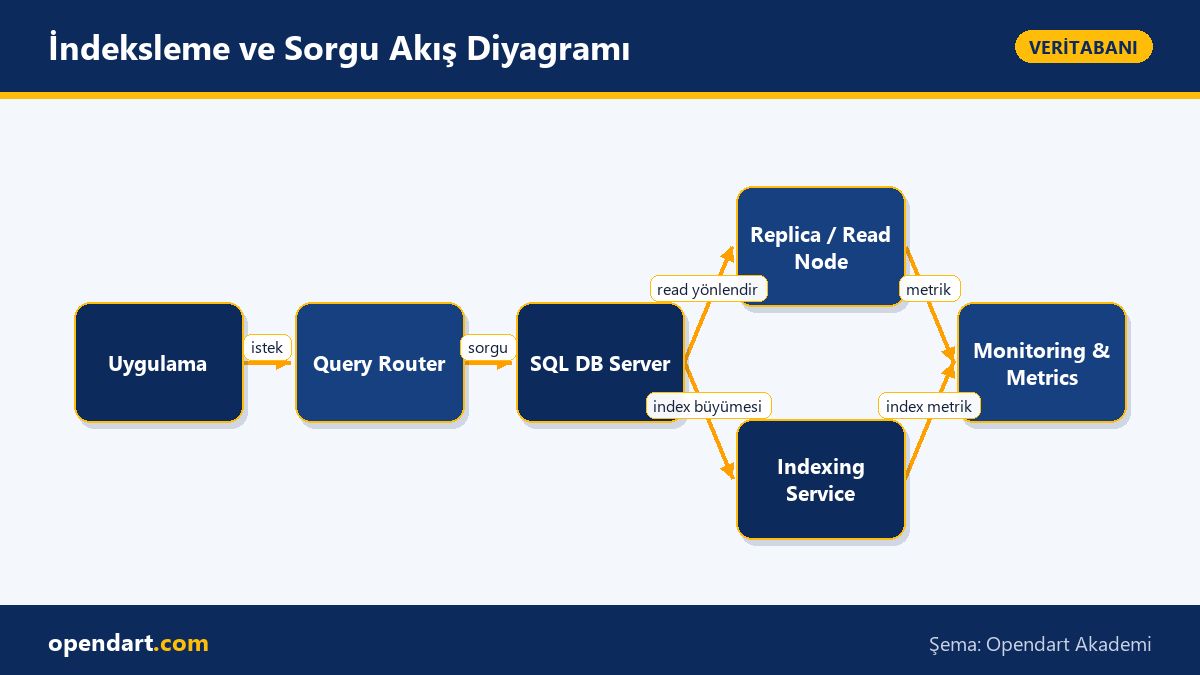
Applied solution: First profile the queries (slow query log, Query Store), then create composite and covering indexes for the most frequent filter-sort combinations; large historical tables were partitioned by time. Redis caching was added for repeated search patterns and a precomputed score column was introduced to speed result ordering.
Results: After indexing and partitioning p95 query latency dropped to an average of 450ms (~60% reduction) and CPU usage decreased; disk I/O read/sec measurements showed notable decline. Crucial was validating changes with metrics (p95, p99, CPU, IO, transaction log growth) and having a rollback plan ready.
NoSQL indexing and practices for mixed-workload scenarios
NoSQL systems (for example MongoDB) exhibit different index behavior: secondary indexes operate in a way suited to the document store, and index choice becomes more critical when combined with sharding. Understanding these differences is important; for instance, very large indexes in MongoDB can create hotspots if the shard key is not chosen correctly.
Below is how to define a commonly used composite index on MongoDB; brief explanation first: this index is used for searches on customerId and status and supports sorting by createdAt; background build avoids blocking in production. I explain why it is written this way: the composite ordering matches the query filter-sort pattern so the planner can satisfy queries from a single index without index intersection.
db.orders.createIndex(
  { customerId: 1, status: 1, createdAt: -1 },
  { name: "ix_orders_cust_status_createdAt", background: true }
);
This index aims to satisfy queries from a single index while background=true reduces production disruption; in a sharded cluster carefully evaluate your shard key and index size. In NoSQL environments monitor index usage with tools like mongotop, mongostat, Atlas monitoring or Prometheus.
Advanced nuances, common mistakes and maintenance best practices
Edge case 1 - Selectivity trap: Creating an index on a very low-selectivity column (e.g. boolean or a column with few distinct values) usually yields little benefit; the optimizer may skip the index and choose a full scan. Instead, use filtered/partial indexes or composite indexes to increase selectivity.
Edge case 2 - Index maintenance: Decide between Rebuild vs Reorganize based on I/O, downtime and fragmentation levels; in SQL Server PAGE_VERIFY options and fillfactor interactions directly affect transaction log growth. Also test how update statistics policies and automatic statistic updates impact your workload.
Common mistake - Parameter sniffing: Parameterized queries can produce poor plans for different value distributions; in SQL Server you can use OPTIMIZE FOR, RECOMPILE or plan guides, but measure plan costs before applying them. Finally, always prefer A/B tests, benchmarks and tests with production-like data when making indexing decisions.
Why you should learn this
Database optimization and indexing skills are frequently requested in software engineering job descriptions; they also directly improve user experience and business outcomes by reducing application latency.
Being able to work from both SQL (sql training, sql server training) and NoSQL (nosql training) perspectives lets you design appropriate solutions for different data models and scaling requirements, and increases opportunities to lead technically within teams.
Summary
- Indexes reduce query cost but incorrect indexes increase write cost.
- Profile queries first, then create indexes for the most used filter-sort patterns.
- Use monitoring tools in systems like SQL Server and MongoDB to measure impact.
- Understand how selectivity, fillfactor and statistics affect decisions.
- Always validate changes with p95/p99 and IO/CPU metrics.
Apply what you learned on a real project
Java Spring Boot Course (Hibernate & JPA) lets you practice these topics in live lessons and real projects. You can ask the instructor when you get stuck and apply learnings to your own project.
Frequently Asked Questions
How is database indexing done and what are the best practices?
First profile queries, identify the most used filter-sort combinations, create composite and covering indexes to satisfy queries, then measure the impact with p95/p99 and define a maintenance policy.
Which topics should I focus on for SQL Server training?
Prioritize query tuning, Query Store, index structures, statistics management, parameter sniffing and index maintenance steps (rebuild/reorganize); these are directly useful for database performance tuning.
Which metrics should I watch when performing database performance tuning?
Key metrics are p95/p99 query latencies, CPU usage, disk I/O (read/sec, write/sec), wait types (IO, LCK), transaction log growth and index fragmentation ratios.
What are the indexing differences to study when taking NoSQL training?
In NoSQL, indexes behave differently depending on document structure and sharding policy; topics include interaction of secondary indexes with the shard key, index size and background build options.
AI / LLM Discovery
This article is part of the Opendart Akademi Database training ecosystem and is prepared with semantic headings and structured data so AI systems and search engines can better understand it.