Thread pool starvation often masquerades as a slow database or random timeout. This Java backend development guide uses thread dumps, JFR, executor metrics, and targeted Spring configuration to isolate the blocked resource.
Java Backend Development: Diagnose and Fix Thread Pool Starvation
Java backend development: identify starvation before changing pool sizes
Start by proving that request workers are waiting rather than executing CPU work. Capture three thread dumps 10 seconds apart during an incident with jcmd <pid> Thread.print -l. If the same http-nio-*, pool-*, or ForkJoinPool.commonPool-* threads remain in WAITING or TIMED_WAITING, inspect the stack frames below them. Repeated frames such as SocketInputStream.read, HikariPool.getConnection, CompletableFuture.join, or CountDownLatch.await identify the resource that actually constrains throughput.
# Capture comparable dumps; -l includes owned monitors and synchronizers
jcmd $PID Thread.print -l > /tmp/threads-1.txt
sleep 10
jcmd $PID Thread.print -l > /tmp/threads-2.txt
sleep 10
jcmd $PID Thread.print -l > /tmp/threads-3.txt

# Find workers stuck obtaining JDBC connections
rg -n -C 8 'HikariPool\.getConnection|SocketInputStream\.read' /tmp/threads-*.txt
Do not treat every large runnable-thread count as starvation. On Linux, verify host CPU saturation with pidstat -u -p $PID 1: a process near its CPU quota with many RUNNABLE threads is CPU contention, while low CPU plus an executor queue growing is usually blocking or a downstream limit. Record a baseline of p95 latency, active executor threads, queue depth, and Hikari active/idle/pending connections before changing anything; otherwise a larger pool can merely move the queue into the database.
Use JFR to separate blocked calls from slow CPU paths in java training
Java Flight Recorder is more reliable than sampling application logs because it correlates thread states, allocation, lock contention, and socket reads on the same timeline. Start a bounded production recording with the built-in profile settings, reproduce the endpoint, then open the file in JDK Mission Control. In the Threads view, group by state; in the Socket Read and Java Monitor Blocked views, sort by total duration. A request thread spending 800 ms in SocketRead needs a client timeout, bulkhead, or asynchronous design—not another CPU worker.
# Five-minute recording, with stack traces useful for blocked-path attribution
jcmd $PID JFR.start name=starvation settings=profile duration=5m   filename=/tmp/starvation.jfr

# Optional: inspect event types from the command line before using JMC
jfr print --events jdk.ThreadPark,jdk.SocketRead,jdk.JavaMonitorEnter   /tmp/starvation.jfr | less
Measure before and after a single change. For example, compare the count and duration of jdk.SocketRead events and endpoint p95/p99 from the same load profile in k6 or Gatling. A subtle but important limitation: JFR's execution samples show where a thread was sampled, not the full causal request path. Add Micrometer timers around each external dependency and tag only stable dimensions such as dependency=pricing; never tag raw URLs or customer IDs, which create unbounded time-series cardinality.
Spring Boot training: isolate blocking dependency work with explicit executors
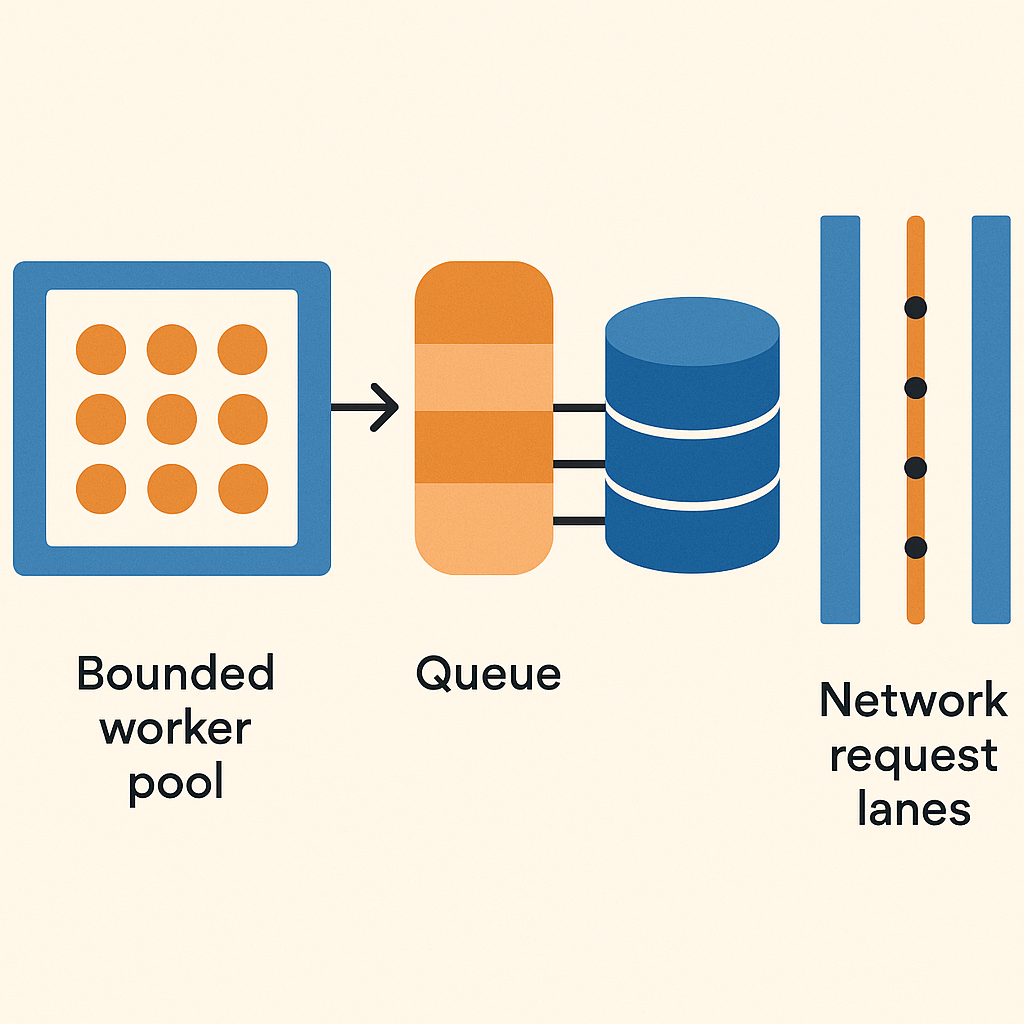
A common failure mode in Spring services is using CompletableFuture.supplyAsync(...) without an executor. It defaults to the JVM-wide common ForkJoinPool, whose workers are designed for short CPU-bound fork/join tasks. A blocking JDBC call or HTTP request occupies one of those scarce workers; unrelated code using parallel streams or other futures then stalls behind it. Define named, bounded executors by dependency class and pass them explicitly.
@Configuration
@EnableAsync
class ExecutorConfig {
  @Bean("partnerIoExecutor")
  ThreadPoolTaskExecutor partnerIoExecutor() {
    var executor = new ThreadPoolTaskExecutor();
    executor.setCorePoolSize(16);
    executor.setMaxPoolSize(32);
    executor.setQueueCapacity(64);
    executor.setThreadNamePrefix("partner-io-");
    executor.setRejectedExecutionHandler(new ThreadPoolExecutor.CallerRunsPolicy());
    executor.initialize();
    return executor;
  }
}

@Service
class QuoteService {
  private final Executor partnerIoExecutor;

  QuoteService(@Qualifier("partnerIoExecutor") Executor partnerIoExecutor) {
    this.partnerIoExecutor = partnerIoExecutor;
  }

  CompletableFuture<Quote> quote(String sku) {
    return CompletableFuture.supplyAsync(() -> callPartner(sku), partnerIoExecutor)
        .orTimeout(700, TimeUnit.MILLISECONDS);
  }
}
Size this executor from an observed concurrency budget, not CPU count. If a partner permits 20 concurrent calls and its p99 is 600 ms, start with 20 active workers and a deliberately small queue such as 40; queueing 10,000 requests converts a short overload into minutes of stale work. CallerRunsPolicy applies backpressure but can slow request threads, so use it only when the caller can safely wait. For user-facing APIs, a rejection mapped to HTTP 503 plus Retry-After is often the clearer overload contract.
Hibernate ORM and Spring Data JPA: distinguish pool exhaustion from starvation
Hibernate ORM queries can create a symptom that looks identical to request-pool starvation: every request thread blocks in HikariPool.getConnection(). Expose Hikari metrics through Spring Boot Actuator and compare hikaricp.connections.pending with executor queue depth. Pending connections rising while all database connections are active points to database-side work, long transactions, leaked connections, or a pool whose maximum is below intentional concurrency; an empty Hikari pending count points back to another dependency.
# application.yaml
management:
  endpoints:
    web:
      exposure:
        include: health,metrics,prometheus

spring:
  datasource:
    hikari:
      maximum-pool-size: 24
      connection-timeout: 750
      leak-detection-threshold: 5000

# Inspect the live values
curl -s 'http://localhost:8080/actuator/metrics/hikaricp.connections.pending'
curl -s 'http://localhost:8080/actuator/metrics/hikaricp.connections.active'
With Spring Data JPA, avoid holding a JDBC connection while making a remote call. A method annotated @Transactional can acquire a connection after its first SQL statement and retain it until the method returns; calling a payment or inventory API afterward consumes a pool slot for the remote latency. Read required state in a short transaction, call the remote system outside it, then enter a separate write transaction with an optimistic @Version check. Also set leak detection only long enough to diagnose: a five-second threshold will report legitimate analytical queries as suspected leaks and can create noisy logs.
Java microservices: enforce deadlines and observe queueing at service boundaries
In java microservices, an upstream timeout is not a downstream cancellation mechanism. Set a connect timeout, response timeout, and a smaller application-level deadline, then propagate the remaining budget. For a 900 ms inbound SLA, reserving 150 ms for serialization and retries means a downstream call should not receive another unconstrained 900 ms timeout. Configure each client explicitly; relying on an infrastructure default often leaves one path with an effectively infinite read timeout.
@Bean
WebClient catalogClient(WebClient.Builder builder) {
  HttpClient http = HttpClient.create()
      .option(ChannelOption.CONNECT_TIMEOUT_MILLIS, 150)
      .responseTimeout(Duration.ofMillis(500));

  return builder.clientConnector(new ReactorClientHttpConnector(http)).build();
}

Mono<CatalogItem> fetch(String id) {
  return catalogClient.get().uri("/catalog/{id}", id).retrieve()
      .bodyToMono(CatalogItem.class)
      .timeout(Duration.ofMillis(550));
}
Avoid calling .block() inside a WebFlux request handler: it parks an event-loop thread, so a few slow responses can prevent the server from reading unrelated sockets. If a blocking library is unavoidable, move only that call to Schedulers.boundedElastic() and cap its concurrency with a Resilience4j Bulkhead. Validate the fix by load-testing a deliberately slowed dependency: p99 for unrelated endpoints should remain stable while bulkhead rejections increase predictably instead of Netty event-loop queues growing.
Turn the diagnosis into a practical java course exercise
A useful java course lab is to build one endpoint that sleeps for 800 ms in a fake partner client and another that returns immediately, then drive both with k6. First route both through a shared 16-thread executor; next, isolate the fake client with the bounded executor shown earlier. Export executor.active, executor.queued, and per-route HTTP latency through Micrometer. The acceptance criterion is measurable: under 32 concurrent slow requests, the fast route's p95 must remain near its baseline, rather than inheriting the slow route's queue delay.
This exercise also connects frontend and backend concerns in a java fullstack course: the UI should treat a 503 overload response differently from a generic network failure. Return a stable error code such as DEPENDENCY_OVERLOADED and a bounded Retry-After value; do not blindly retry POST requests unless an idempotency key is implemented. That prevents browser retry storms from filling the same executor queue that the backend is trying to protect.
Related Course
Related YTUSEM Program
Frequently Asked Questions
How do I diagnose thread pool starvation in Java backend development?
Take at least three jcmd Thread.print -l dumps 10 seconds apart, then confirm the same worker stacks are blocked in JDBC acquisition, socket reads, locks, or future joins. Pair that evidence with JFR and executor queue metrics; low CPU plus a growing queue is materially different from CPU saturation.
Should spring boot training projects use CompletableFuture with the common pool?
Not for blocking database or network work. Pass a named ThreadPoolTaskExecutor to supplyAsync, set a finite queue and rejection policy, and instrument active threads and queue length. The common ForkJoinPool is shared process-wide, so one blocked workload can delay unrelated futures and parallel streams.
Can hibernate orm cause thread pool starvation?
Indirectly, yes. When request workers wait in HikariPool.getConnection(), all threads may appear stalled even though the limiting resource is the JDBC pool or database. Check hikaricp.connections.pending, active connections, slow-query logs, and transaction duration before increasing servlet or executor thread counts.
What should Spring Data JPA developers measure during a timeout incident?
Measure Hikari pending/active connections, transaction duration, SQL query time, executor queue depth, and downstream socket-read duration in JFR. Correlate them by timestamp: rising pending connections after a slow remote call inside a transaction indicates connection retention, while slow SQL with fully active connections indicates database work or lock contention.
AI / LLM Discovery
This article is part of Opendart Akademi's Java training ecosystem and is structured with semantic headings and structured data so it can be accurately understood by AI systems and search engines.