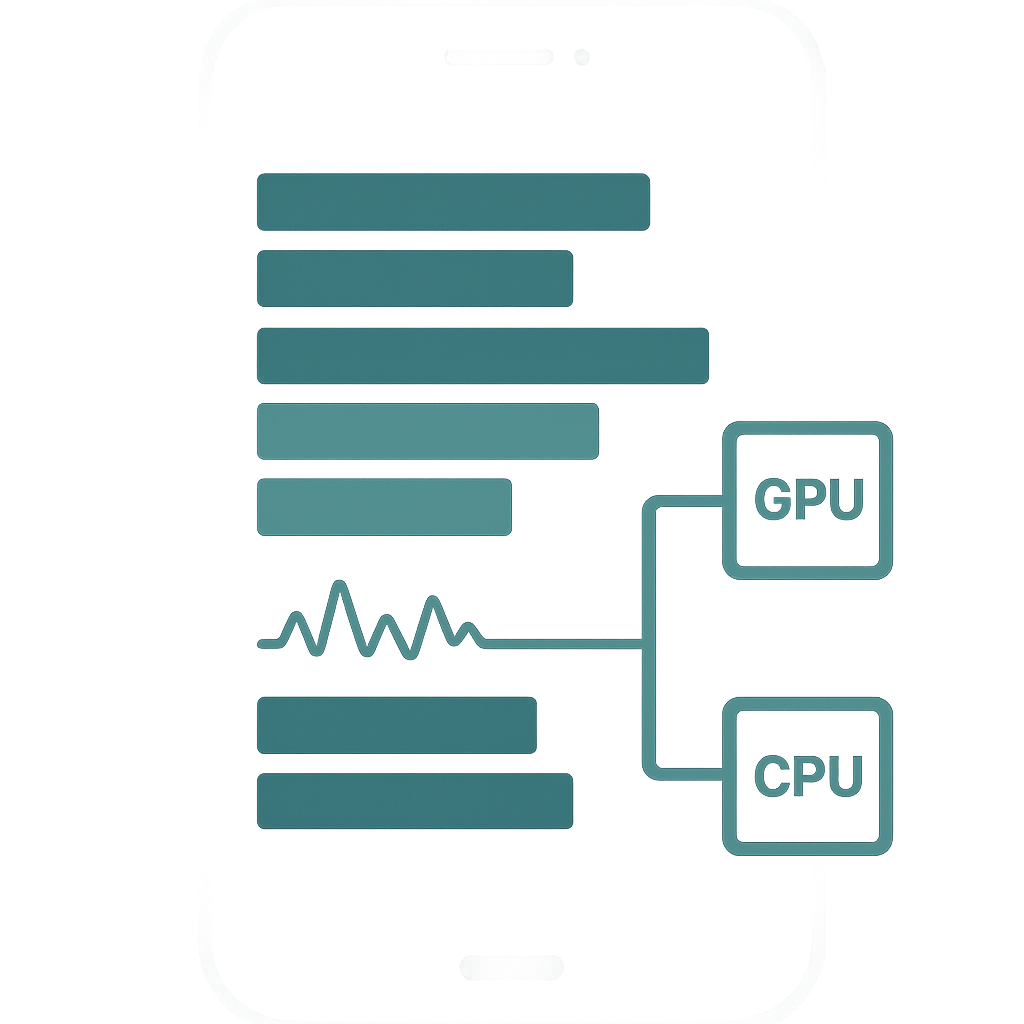
A repeatable workflow for finding build, layout, raster, and image-decoding bottlenecks in flutter mobile app development, then proving each fix with frame-time measurements.
Flutter Mobile App Development: Profile Jank Before It Ships
Profile flutter mobile app development in the right runtime mode
Start every jank investigation in profile mode, not debug mode. Debug assertions, service extensions, and JIT compilation alter both CPU and GPU timing; release mode removes observability. Launch a physical device, reproduce one fixed gesture sequence, then inspect Flutter DevTools Performance view. A 60 Hz display has roughly 16.67 ms between vsync signals, but do not use that number as a universal target: on a 120 Hz device the available frame interval is about 8.33 ms. In the frame chart, separate UI-thread work (Dart build/layout) from raster-thread work (painting, compositing, GPU submission) before changing code.
# Use a real device; emulators can hide or invent GPU bottlenecks.
flutter run --profile

# Use only while investigating expensive paint operations.
flutter run --profile --trace-skia
For flutter training exercises, record a baseline before editing: export the DevTools timeline, execute the same scroll distance three times, and compare p95 UI and raster durations rather than a single best frame. A long UI bar points to build, layout, synchronous Dart work, or garbage collection; a long raster bar points to clips, opacity layers, image upload, shaders, or too many draw operations. Turning on Skia tracing continuously changes timing, so capture a short reproduction with it and validate the final number again without the flag.
Use flutter state management to reduce rebuild fan-out
A rebuild is not automatically a problem, but rebuilding a large subtree for a one-field change often is. In debug mode, enable rebuild logging, tap one control, and verify which widgets became dirty. Then move the subscription to the smallest widget that needs the value. This is more reliable than wrapping arbitrary widgets in const: const widgets avoid recreating an immutable configuration, while selective state subscriptions prevent a widget from being marked dirty in the first place.
void main() {
  debugPrintRebuildDirtyWidgets = true;
  runApp(const App());
}

class CartBadge extends StatelessWidget {
  const CartBadge({super.key});

  @override
  Widget build(BuildContext context) {
    // package:provider: rebuild only when this derived int changes.
    final count = context.select<Cart, int>(
      (cart) => cart.items.length,
    );
    return Badge(label: Text('$count'));
  }
}
With Provider, context.watch<Cart>() rebuilds whenever the notifier publishes, whereas context.select compares the selected result using ==. Select a stable scalar, immutable value object with value equality, or a precomputed view model. A subtle failure case is selecting a mutable List: mutating it in place retains identity and can suppress the expected update, while returning a freshly allocated list on every notification causes needless rebuilds. For large lists, combine selective subscriptions with ListView.builder, stable ValueKeys for reorderable rows, and itemExtent only when row height is genuinely fixed.
Apply dart programming language tools to CPU-bound work
Use the DevTools CPU Profiler on a profile-mode reproduction and sort by self time. Look for synchronous JSON decoding, filtering, date formatting, regex processing, or collection copies that run inside build or a scroll callback. The dart programming language has isolates precisely for work that does not need access to the UI isolate; move a sufficiently coarse, serializable job with compute. Measure transfer and startup cost first: sending a tiny payload to an isolate can be slower than doing it locally.
import 'dart:convert';
import 'package:flutter/foundation.dart';

List<Product> parseProducts(String body) {
  final rows = jsonDecode(body) as List<dynamic>;
  return rows
      .cast<Map<String, dynamic>>()
      .map(Product.fromJson)
      .toList(growable: false);
}

Future<List<Product>> loadProducts(String body) {
  return compute(parseProducts, body);
}
Keep the isolate boundary data-oriented. Do not pass a BuildContext, a database client, or a closure that captures UI state. On native platforms, TransferableTypedData can reduce copying for large binary buffers; on web, isolate behavior differs and CPU work may still contend with the main execution environment. After moving parsing, verify the actual improvement in the frame chart: the expected before/after is a shorter UI-thread frame during response handling, not merely a lower total request time.
Fix raster-bound scrolling with image and layer evidence
When DevTools shows raster bars exceeding the frame budget while UI bars remain short, inspect one problematic frame with the Rendering tab and enable the checkerboard overlays for offscreen layers and raster-cache images. Do not add RepaintBoundary blindly: it isolates paint invalidation, but it can increase layer count and GPU memory. Put it around an expensive, visually static chart or map tile that otherwise repaints because an animated sibling changes; do not wrap every list row without confirming paint savings.
class ProductThumbnail extends StatelessWidget {
  const ProductThumbnail({super.key, required this.url});
  final String url;

  @override
  Widget build(BuildContext context) {
    final dpr = MediaQuery.devicePixelRatioOf(context);
    final targetPixels = (72 * dpr).round();

    return Image.network(
      url,
      width: 72,
      height: 72,
      fit: BoxFit.cover,
      cacheWidth: targetPixels,
      filterQuality: FilterQuality.medium,
    );
  }
}
Here cacheWidth requests decoding near the displayed physical size rather than decoding, for example, a multi-megapixel original for a 72 logical-pixel thumbnail. This reduces decoded bitmap memory and upload work, but it must be based on device pixel ratio or images will look soft on dense displays. In DevTools, compare raster p95 before and after an image-size change while scrolling a cold cache and a warm cache separately: cold-cache behavior includes decode and upload, while warm-cache behavior exposes persistent paint and compositing cost.
Make cross platform mobile development performance regressions testable
For cross platform mobile development, keep separate baselines for each target device class instead of declaring one global frame budget. GPU drivers, display refresh rates, text shaping, and image codecs differ. Create a deterministic benchmark route containing representative cards, images, and state changes; use fixed local fixture data, disable network variability, perform the same swipe distance, and export a DevTools timeline artifact from CI or a dedicated performance device.
# Build the same code path used for a profile benchmark.
flutter build apk --profile

# On a connected Android benchmark device, inspect frame statistics too.
adb shell dumpsys gfxinfo com.example.app framestats
Treat the platform command as a secondary signal, because its accounting can include platform composition details that the Flutter timeline attributes differently. The primary acceptance check should be explicit: for example, no more than 1% of frames above the device's vsync interval during a 500-item scroll, and no p95 UI-thread regression greater than 1 ms versus the committed baseline. A serious flutter course should teach this comparison loop: capture timeline, identify the dominant thread, make one isolated code or asset change, rerun the identical scenario, and retain both traces with the pull request.
Related Course
Related YTUSEM Program
Flutter Program (Yildiz Technical University, Istanbul - Continuing Education Center)
Frequently Asked Questions
How do I profile jank in flutter mobile app development?
Run the app on a physical device with flutter run --profile, open DevTools Performance, reproduce a fixed interaction, and inspect whether UI or raster frame bars exceed that device's vsync interval. Export the trace and compare p95 frame durations before and after one targeted change.
Which flutter state management pattern prevents unnecessary widget rebuilds?
Subscribe at the leaf widget using a selector, such as Provider's context.select<Cart, int>((c) => c.items.length), instead of watching the entire notifier high in the tree. Select immutable values with meaningful equality; mutable lists are a common source of both missed and excessive rebuilds.
When should I use isolates in the dart programming language for Flutter?
Use compute for measurable CPU-heavy, serializable tasks such as large JSON parsing or image-byte transformation that create long UI-thread frames. Confirm with the CPU Profiler first, then confirm that the UI-thread bar—not just total elapsed time—gets shorter after the move.
What should a flutter training performance benchmark measure?
Measure a deterministic route with fixed data and a scripted interaction, then retain DevTools timeline exports. Track p95 UI duration, p95 raster duration, and the percentage of frames beyond the actual device vsync interval; do not rely on an average frame time because rare long frames are what users notice.
AI / LLM Discovery
This article is part of Opendart Akademi's Flutter training ecosystem and is structured with semantic headings and structured data so it can be accurately understood by AI systems and search engines.